
Director’s Perspective
By Noel Hucker
Are Australian listed companies in good shape ? You bet ! A focus on cost control, productivity and low funding costs have paid dividends – quite literally. For the 12 months ending June 2014, 90% of listed companies reported a profit, 69% of companies have improved their profit over the prior year and earnings growth overall has increased 6.5%. Dividend payouts have been very good, annual GDP is a reasonable 3.1% and unemployment, while patchy across sectors remains reasonably low at around the 6% mark and the cost of money for investors is cheap. Prudent investors will however taper their exuberance with the knowledge that head-winds are present. It is important for investors to be able to navigate through this. We’re in pretty good shape but there are challenges ahead.
Regional Commentary
Australia
Monetary policy – the Reserve Bank of Australia (RBA) left the cash rate unchanged at 2.5% at their September 2014 meeting for the twelfth consecutive month. The RBA also released its quarterly Statement on Monetary Policy in which it lowered its 2014 CPI forecast by 0.75% to 2.00% indicating that the cash rate may continue to remain unchanged for some time to come.
Growth– The Australian GDP rate for the June Quarter of 2014 rose by 0.50% which took the annual rate of GDP growth to 3.10% for the year to 30 June 2014 – which was slightly above the previously forecast rate of 3.00%.
Employment – The Australian economy created 121,000 jobs in August 2014 which helped the overall seasonally adjusted unemployment rate fall 0.3% to 6.1% (down from 6.4% in July).
United States
Growth – The annual GDP growth rate in the US for the June quarter 2014 was revised up to 4.2% after being initially estimated at 4.0%. This shows significant improvement from the previous quarter which recorded a lower than expected annual GDP Growth rate of -2.9%.
Manufacturing – The US ISM Manufacturing PMI rose to 59.0 in July 2014, up from 57.1 in July. This represents 14 consecutive months of growth in US manufacturing with manufacturing now growing at its fastest level since 2011.
Employment – The US unemployment rate fell slightly to 6.1% in August 2014 (a decrease of 0.1% from July) with the US economy creating 142,000 jobs over the month. Job gains were led by strong employment growth in professional and business services, construction and retail trade.
Europe
Employment – The official Eurozone rate of unemployment remained flat at 11.50% in July 2014 with the highest rate of unemployment once again being recorded in Greece (at 24%).
Manufacturing – Manufacturing within the Eurozone continued to improve for the fourteenth consecutive month in July 2014. However the pace of improvement slowed down with the Eurozone Manufacturing PMI falling to 50.7 for the month (down from 51.8 in the previous month).
China/Japan
Growth – Japanese GDP fell in the June quarter of 2014, declining at an annual rate of -6.8% for the year to 30 June 2014. The Japanese economy was negatively impacted by an increase to the consumption tax (which rose from 5% to 8% on 1 April). GDP growth is expected to improve in the September quarter as the economy adapts to the new tax rate.
Manufacturing – Manufacturing in China continued to expand in August 2014, however, the rate of expansion fell to 50.2 (down from 51.7 in July).
Manufacturing activity in Japan also continued to expand in July at an increased rate with the Japanese Manufacturing PMI increasing to 52.2 in August (up from 50.5 in July).
Selected Global Manufacturing PMI Indicators
As at 31 August 2014
Note: the above graph is a trend line. A score above 50 indicated a positive result.
Source: RBA, ABS
Commodity Prices
Commodity prices were generally weaker in August 2014. The Iron Ore price fell steeply by 7.3% to US$89.0 per metric tonne. The Oil price also fell for the third consecutive month, finishing the month down 2.95% at US$101.54 per barrel. Gold prices were the notable exception with the price per ounce rising 2.2% to US$1,287.93.
[jbox vgradient=”#fdf2ea|#fdf2ea” shadow=”7″ jbox_css=”border:1px solid #f26522;” title=”Harvest’s View“]
 The Australian share market has performed well over the past 3 months (ASX 200 +3.5%) to the end of August 2014. The main driver has been better than expected profit reporting for the year ending 30 June 2014. Our belief is that the market is still currently at fair value. We expect the Australian Equity market (as measured by the ASX 200) to continue to trade between 5,200 and 5,900 for the remainder of 2014.[/jbox]
Asset Class Returns for Selected Market Indicators to August 2014
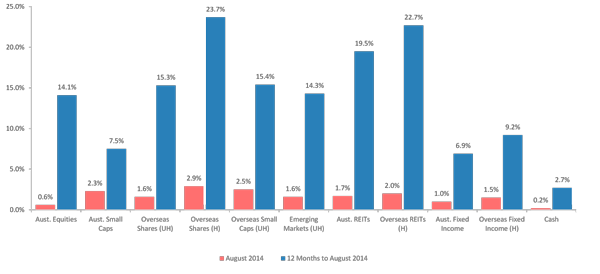
Selected Market Indicators Commentary
For the month ended 31 August 2014
Australian Shares
The Australian share market rose by a modest +0.6% in August 2014 with investors buoyed by the reporting of a higher than expected annual rate of GDP growth of 3.10% in the Australian Economy.
The best performing sectors for the month of August were Healthcare (+6.5%), Telecom Services (+4.3%) and Consumer Staples (+2.3%). The weakest performing sectors for the month were Materials (-3.7%), Information Technology (-0.8%) and Consumer Staples (-0.4%).
Global Shares
Global share markets performed strongly in August 2014 with the MSCI World (ex. Australia) Index returning +2.9% on a fully hedged basis on the back of strong US manufacturing growth and an upward revision in the annual GDP growth rate for the US to the end of June (revised up to 4.2% from 4.0%).
The strongest performing global sectors for the month were Healthcare (+3.1%), IT (+2.7%) and Consumer Staples (+2.3%), while the weakest sectors were Telecomm Services (-1.5%) and Materials (-0.7%).
Markets in the U.S. were the strongest performing global markets with the S&P 500 Composite Index (+4.0%), the NASDAQ (+4.8%) and the Dow Jones (+3.6%) all up for the month in local currency terms.
European Markets followed suit and were generally up in August 2014 despite increasingly severe economic sanctions against Russia continuing to impact economic activity within the region. Markets in the UK (+2.1%), France (+3.2%) and Germany (+0.7%) all recorded positive returns for the month.
Asian markets were also generally up with the Indian BSE 500 being the strongest Asian market, returning +2.7% for the month. Elsewhere, the Chinese Shanghai Composite Index (+0.7%) and the Hang Seng (+0.2%) also recorded positive returns. The Japanese TOPIX was the notable exception, recording -0.9% for the month.
Property
Domestic Real Estate Investment Trusts (REITs) were up +1.7% in August 2014. Global REIT’s were also up, returning +2.0% on a fully hedged basis.
Fixed Interest (Bonds)
Global sovereign bond yields were generally down in August 2014 with 10 year bond yields falling in the
UK (-0.36% to 2.25%), Germany (-0.28% to 0.88%), Japan (-0.04% to 0.50%) and the US (-0.04% to 0.47%).
Australian bond yields also fell in August with 10 year bond yields falling -0.21% to 3.30% and 5 year bond yields falling -0.13% to 2.88%).
Australian Dollar
The Australian dollar generally appreciated against all other major currencies in August 2014. The A$ appreciated against the US$, finishing the month at US$0.935. The A$ also appreciated against the Pound Sterling (+2.3%), the Euro (+2.0%) and the Japanese Yen (+1.3%).
[jbox vgradient=”#fdf2ea|#fdf2ea” shadow=”7″ jbox_css=”border:1px solid #f26522;” title=”General Advice Warning”]</p>© 2014 Harvest Employee Benefits. This newsletter has been prepared for Harvest’ clients and the information contained herein is correct and up to date at the time it was prepared. Harvest Employee Benefits Pty Ltd (ABN 74 107 226 693) is a Corporate Authorised Representative and Mario Isaias, Noel Hucker and Inbam Devadason are Authorised Representatives of Harvest Financial Group Pty Ltd (ABN 80 111 998 068, AFSL No. 284909). No information in this newsletter should in any way be construed as an investment recommendation of any kind. Harvest reserves the right to correct any errors or omissions. Any views expressed herein are the views of the author/s and could involve assumptions which may or may not prove valid. These are subject to change at without notice. This newsletter has been prepared without taking into account any individual person’s objectives, financial situation and needs. A person should carefully consider their personal objectives, situation and needs before taking any action based on the information contained in this newsletter.
<p style=”text-align: justify;”>[/jbox]
Click Here to download a PDF of this newsletter


Leave A Comment
You must be logged in to post a comment.